Note: Every year, OpenSignal publishes an Android Fragmentation Report, detailing a few conceptions about the relationship between how many different devices there are on the market to how this makes developing for Android more difficult. Everything from OS fragmentation to screen size fragmentation is measured, but in actuality, Google has released countless tools for developers to minimize any hardship there is to get an app working on any and all supported Android devices. Long story short, we enjoy these reports for the pretty graphs detailing all of the phones, not the misleading talk on how Android is a fragmented mess and is scaring developers away. Enjoy.
Fragmentation is an interesting word to Android users. It used to represent how bad Android was with regard to OS updates and app development, but it’s really just the nature of having a free OS available to any OEM that wants to use it. Yes, Google does its best at making updates readily available for OEMs who want to implement them, and powering developers with tools to create the best apps they can regardless of a device’s screen size, but according to the latest Android Fragmentation Report posted by OpenSignal, there is still a long ways to go.
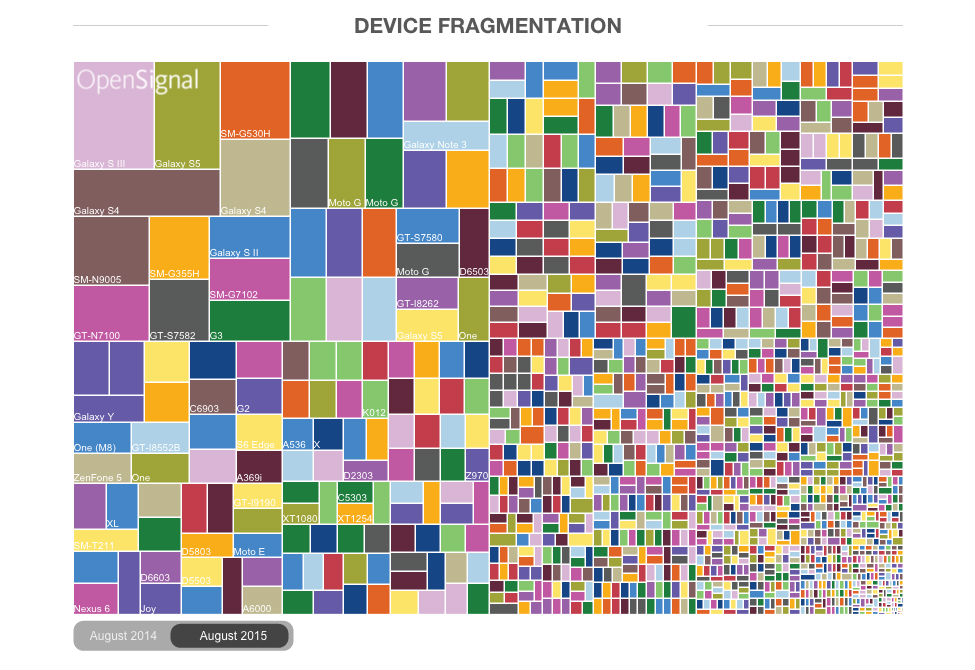
Disclosed in their findings, over the span of a year from August 2014 to August 2015, over 24,000 different Android devices can access Google Play and download apps, making application optimization a possible struggle for developers. In 2013, there was only about 12,000 devices, meaning “fragmentation” has doubled in just two years. The above graph allows us to visualize just how complex of an ecosystem we are working with. At the top, we have Samsung with the Galaxy S3, Galaxy S4, and Galaxy S5 holding a substantial amount of the smartphone market. Currently, Samsung accounts for nearly 40% of the Android smartphone market.
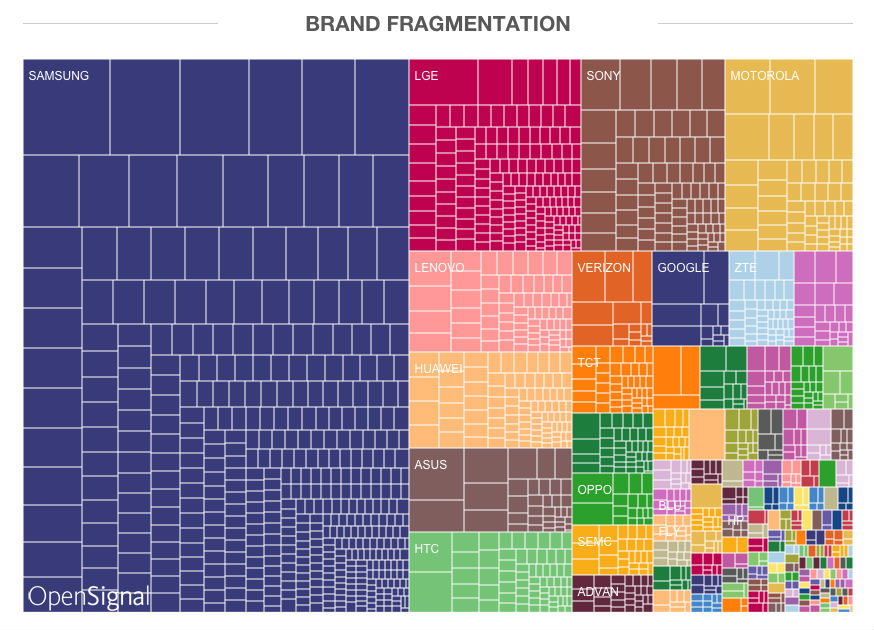
Going beyond the device fragmentation, “Brand Fragmentation” is also a subject OpenSignal touches on. As detailed in the graph, there are nearly 1,300 distinct Android manufacturers, with Samsung owning the majority, and LG, Sony, Motorola, as well as HTC filling out the field. In 2012, Samsung held nearly 50% of the total market, but thanks to hundred of competitors now in emerging markets creating mid-range devices, Samsung’s number has been drawn back quite a bit to under 40%.
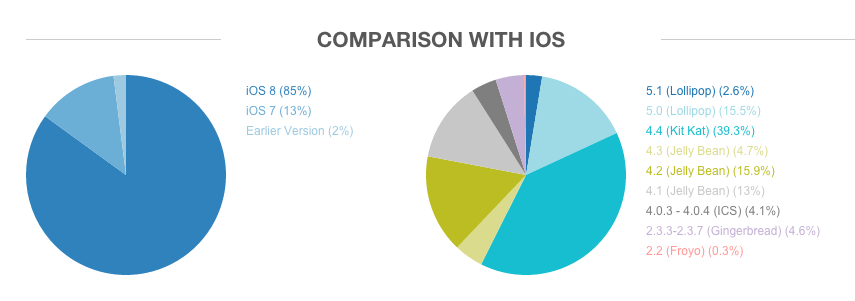
Of course, what good would an Android Fragmentation Report be if there was no detailed comparison to iOS. The iOS chart shows there is basically only two version of iOS to choose from, iOS 7 and iOS 8, while on the other hand, Android has nine versions currently running in the free world. Just as we saw in the latest Android Distribution numbers, Kit Kat remains on top, running on 39% of phones, with Lollipop (the latest and greatest version of Android), running on just 18% of phones.
These graphs may seem complex, and even a little scary, but as an Android fan, the one thing I enjoy most about Google’s mobile OS is the freedom of choice I have to choose whichever device suits me best. There are the high-end devices, mid-range devices, and entry-level phones, with every possible option in between, meaning that no matter your income level, where you live, or your lifestyle, there is an Android device that likely suits all of your needs and wants.