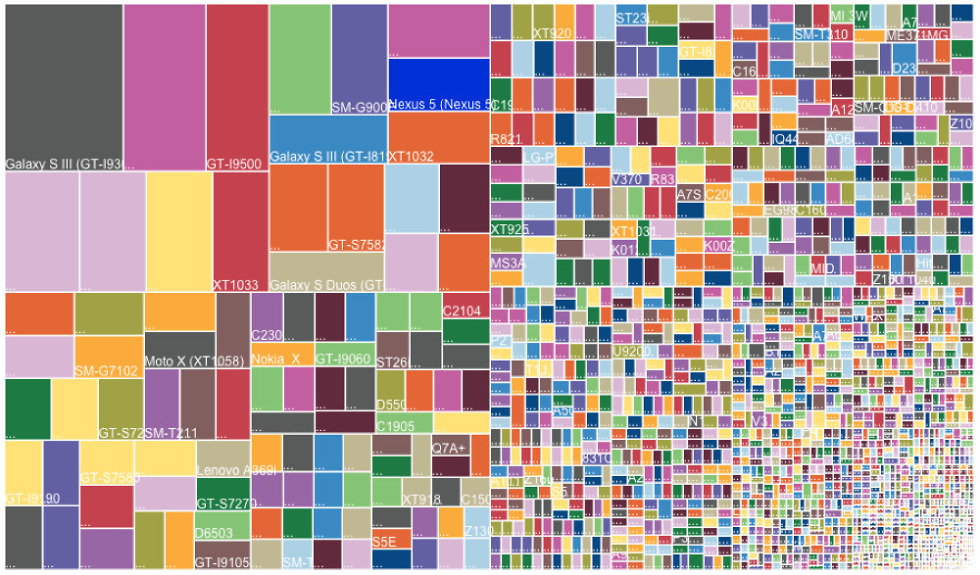
That chart, situated at the top of this post, represents 18,796 different Android devices that are in the wild, according to OpenSignal’s latest Android “fragmentation” report which looks at the number of devices that have downloaded their app over the last couple of months. That, is a lot of devices. In fact, in last year’s report, OpenSignal reported that there were 11,868 different devices, which means we saw a 60% growth year-on-year. In 2012, that number stood at 3,997 individual Android devices. Calling the growth of the Android platform “impressive” would be an understatement.
So what’s the point of this report? OpenSignal wants to show the level of “fragmentation” in Android devices, to somehow relate that back to the benefits and negatives it creates for developers. Mostly, they point out the negatives, but do note that the range of devices in the Android world also makes the opportunity for developers greater than any other platform.
We really just like looking at this report for the neat charts and to see which devices and manufacturers are leading the Android charge.
Here are some notes from the report:
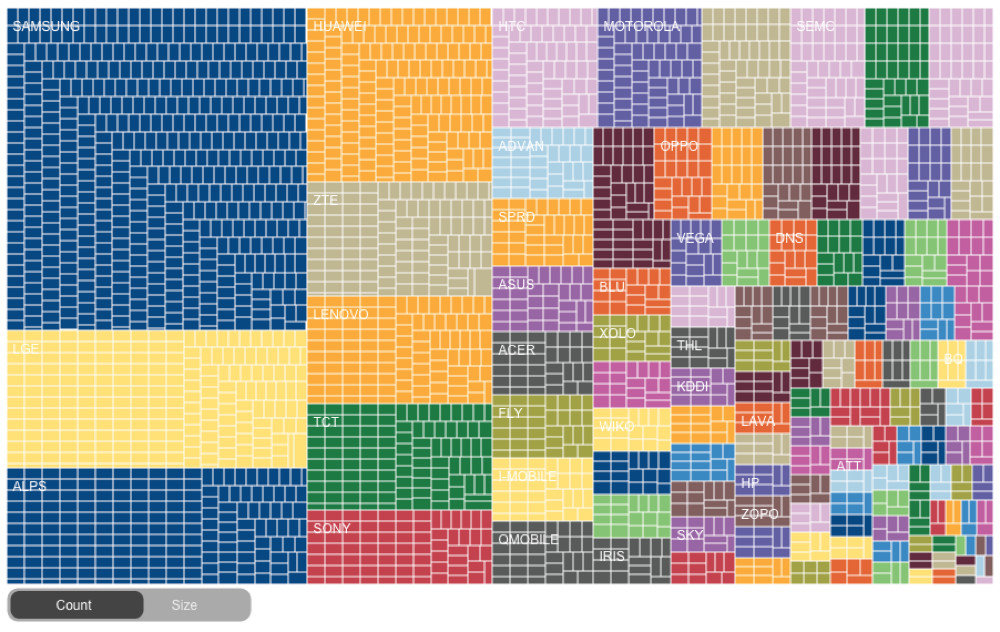
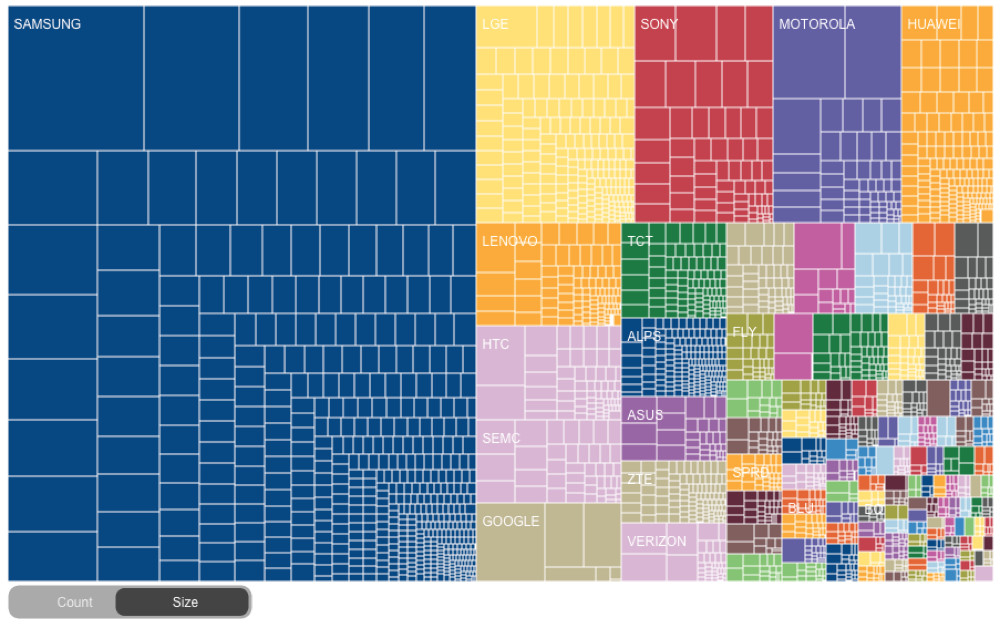
- Samsung still dominates, with the Galaxy S3 owning the biggest piece of the “fragmentation” pie. Following the Galaxy S3, the Galaxy S4 and Galaxy S5 also carry plenty of the load, along with the Note series. Samsung also ranks highest in terms of devices available, makes up for 43% of the total share (down from 47.5%), and owns 12 of the 13 most popular devices.
- Google’s Nexus 5 and Motorola’s Moto G, surprisingly, are next in line behind a variety of Samsung devices. We know that the Moto G has sold well for Motorola, but the Nexus 5 has been a mystery since Google refuses to release sales numbers for it.
- Sony apparently stands in second place with 4.8% of the share, with LG right behind it. The chart actually makes it look like LG is in 2nd, but we’ll take their word for it.
- The Chinese takeover is real. Huawei, ZTE, and Lenovo all have major presences in terms of devices.
- HTC remains mostly irrelevant in these charts. The One (M7) and One (M8) barely make a dent when compared to the other flagship devices we just mentioned.
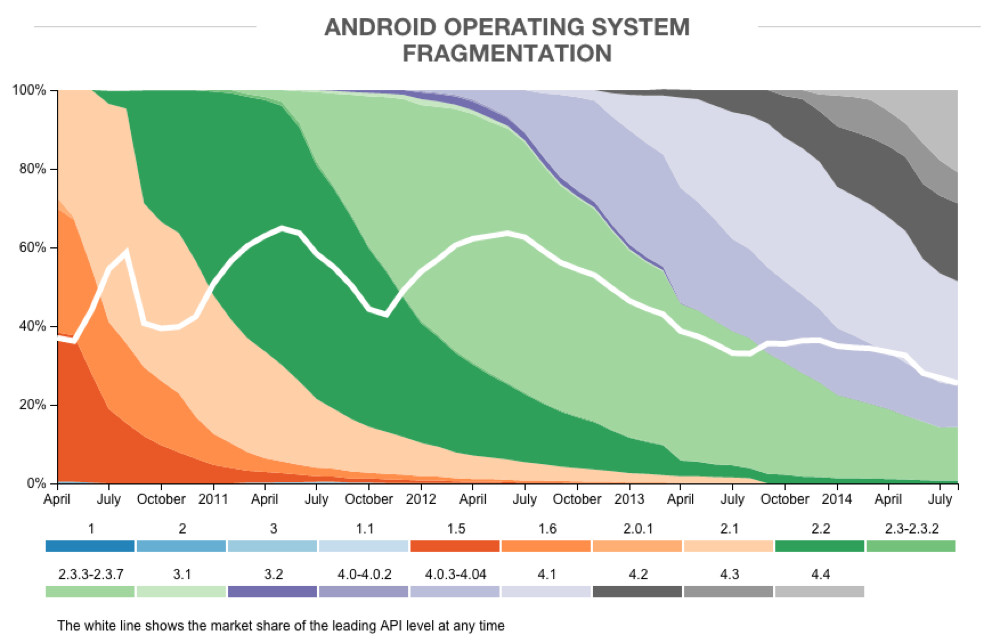
- 20.9% of devices tracked are on Android 4.4+ Kit Kat. Almost 50% were on Jelly Bean. In other words, more than 70% of Android devices are on the top two version of the operating system, even if these charts make it look much worse than that.
- The report calls out Samsung for adding new sensors to their newer devices each year, using the term “fragmentation” to describe the growing number used. They don’t necessarily ding them for trying to innovate, but as we all know, the term “fragmentation” typically means something negative when using it to refer to Android.
Overall, the report shows us a bunch of information which has been documented often. Android continues to grow like crazy. New versions of Android take time to adopt, because there are dozens of manufacturers involved, along with carriers. New sensors are being introduced. Samsung is still winning, though their share has taken a hit in the last year. Chinese OEMs are coming.
Finally – piss off, OpenSignal, for calling this a “fragmentation” report.
Collapse Show Comments78 Comments